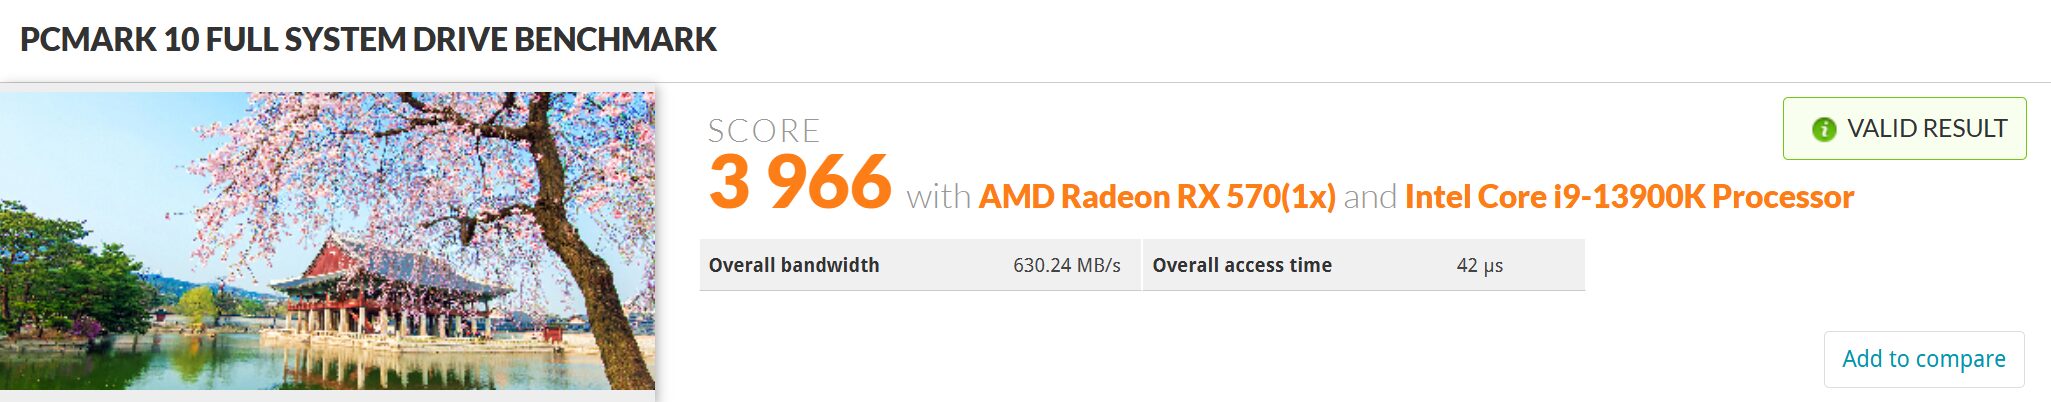
PCMARK 10 FULL SYSTEM STORAGE BENCHMARK
PCMark 10 Storage Benchmarks produce an overall score as a measure of drive performance. Comparing devices is as simple as comparing scores. The tests also measure and report the bandwidth and average access time performance for the drive. Each test uses traces recorded while performing real-world tasks such as booting Windows 10, starting applications such as Adobe Photoshop and Illustrator, working with applications such as Microsoft Excel and PowerPoint, and copying several large files and many small files.
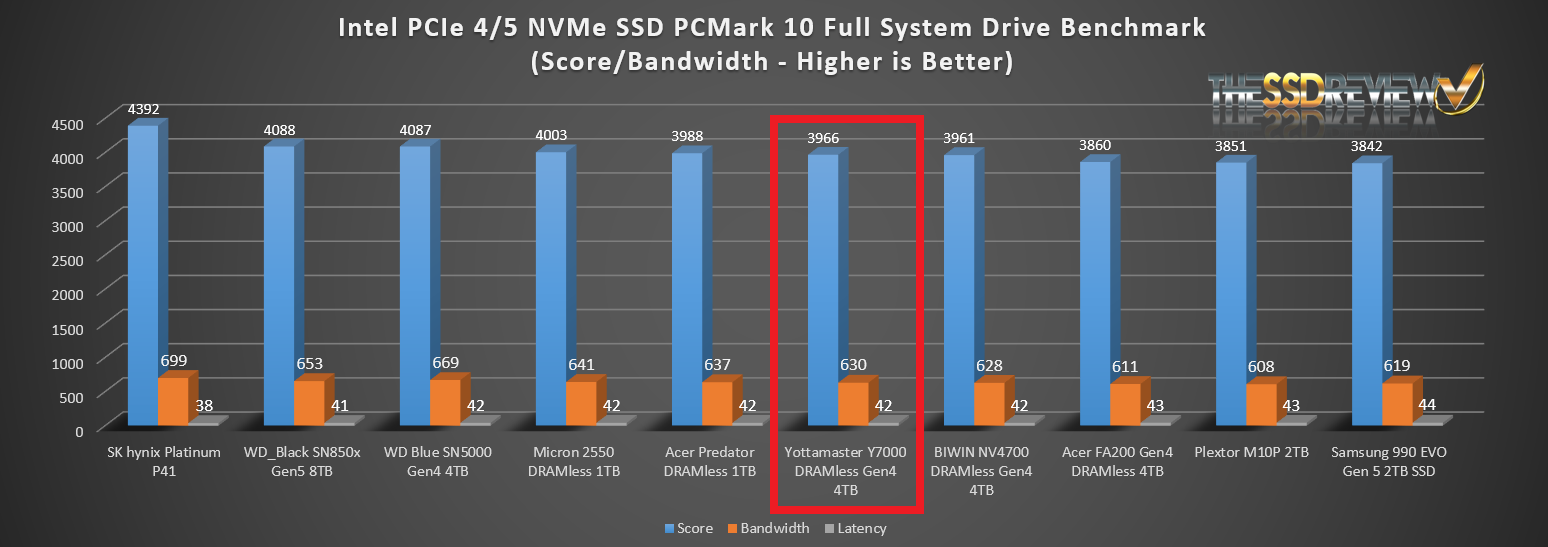
Our test regimen is inclusive of several different chipsets and our goal is to provide the best result we can obtain with each SSD. In this instance, we elected to post our result obtained with the Intel Z790 chipset as that was the best result obtained. We have made note previously in our reports that our results aren’t necessarily a completely valid result as the entire test set with all SSDs has not been completed with any single chipset as this would be a very lengthy process. The result for the Z890 Test Bench, in this instance, was lower and can be found here.
This chart does not depict where the Yottamaster Y7000 Pro stands overall, but rather, displays where it stands in comparison to close rivals. It is rather interesting to note that we see four BIWIN manufactured products side-by-side.
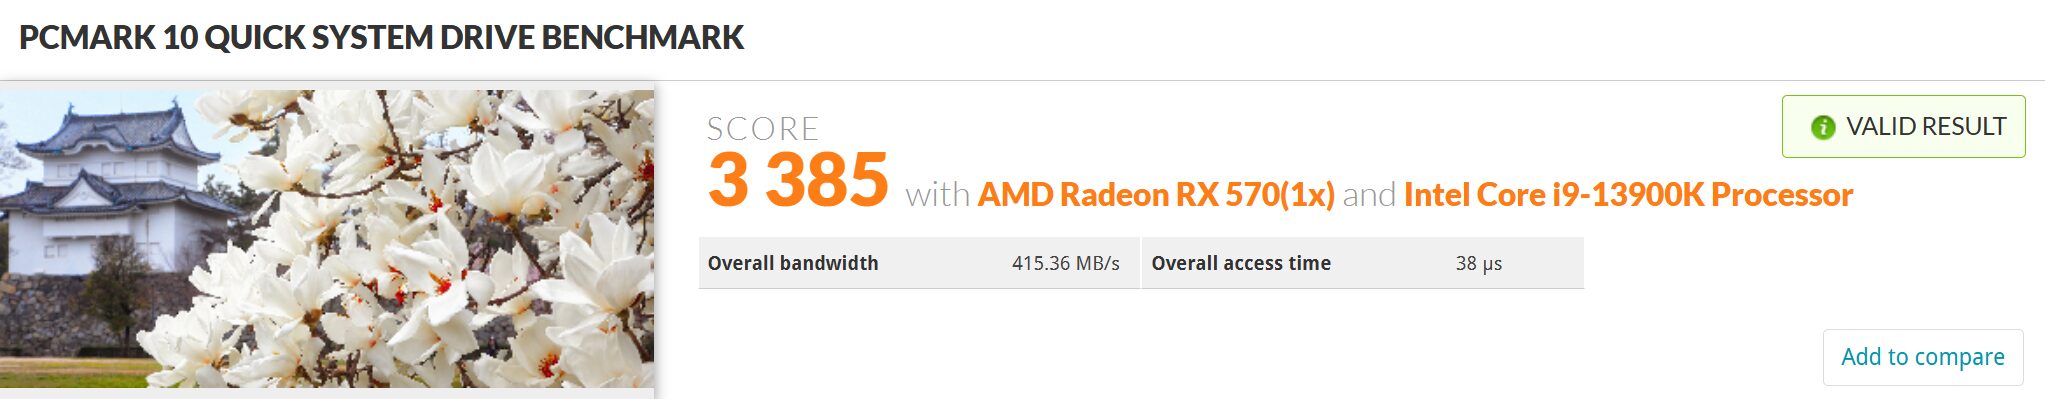
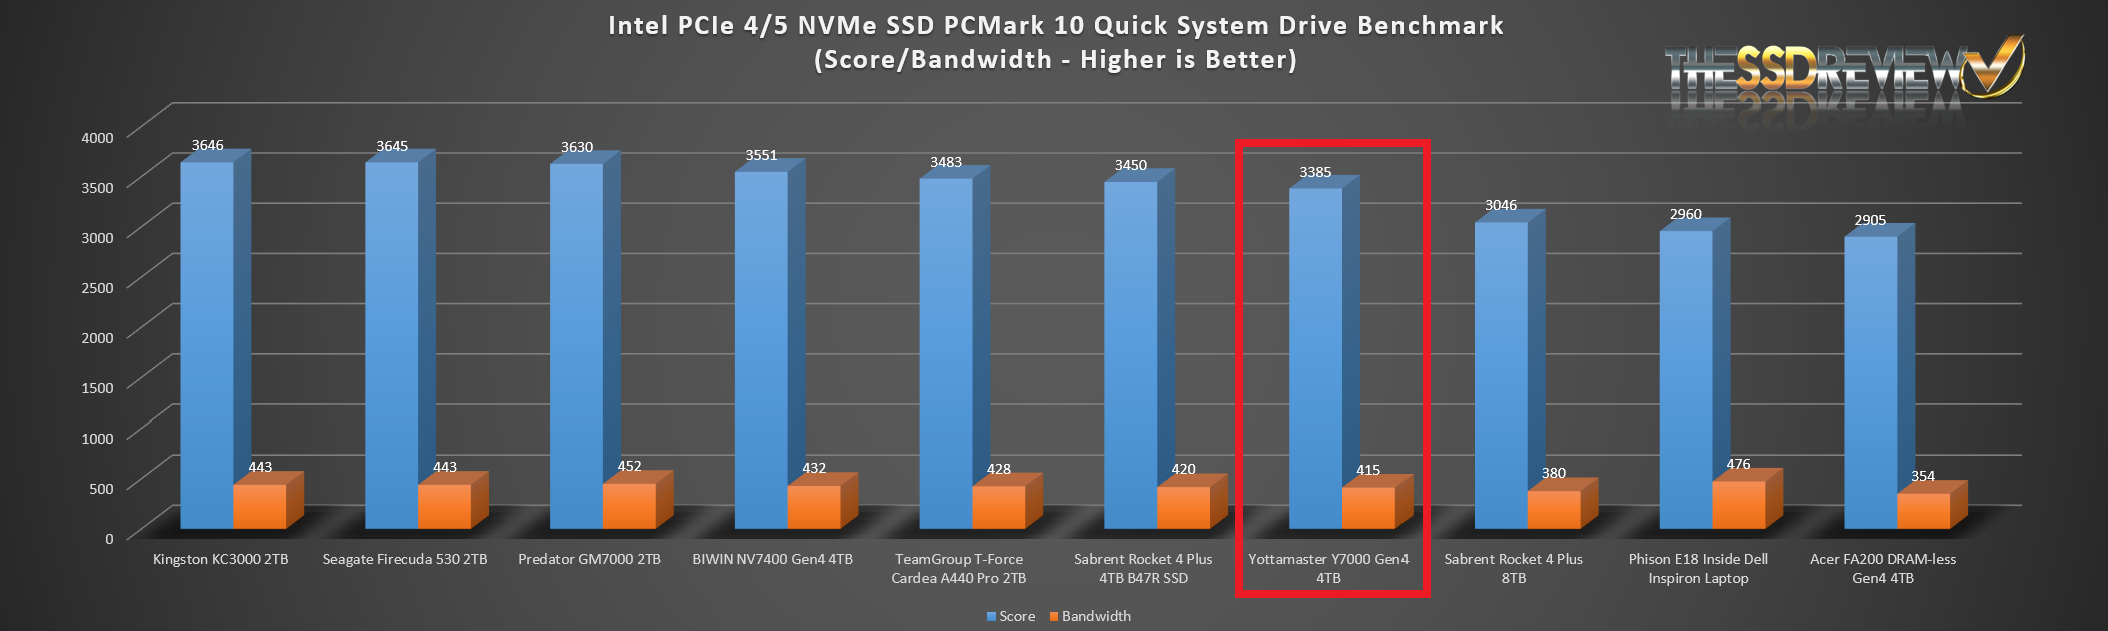
PCMARK 10 QUICK SYSTEM STORAGE BENCHMARK
The Quick System Drive Benchmark is a subset of the Full test and is more representative of typical daily usage to show what would be expected regarding hybrid SSD performance on a day-to-day basis.
Our test regimen is inclusive of several different chipsets and our goal is to provide the best result we can obtain with each SSD. In this instance, we elected to post our result obtained with the Intel Z790 chipset as that was the best result obtained. We have made note previously in our reports that our results aren’t necessarily a completely valid result as the entire test set with all SSDs has not been completed with any single chipset as this would be a very lengthy process. The result for the Z890 Test Bench, in this instance, was lower and can be found here.
This chart does not depict where the Yottamaster Y7000 Pro stand overall, but rather, displays where it stands in comparison to close rivals. By ratings this displays the mid-range to lower range of the charts and, once again, it is rather interesting that the four BIWIN manufactured SSDs are so close, considering we have reviewed so many. This is simply a slice of ten SSDs in a row.
TRUE DATA TESTING
For our True Data Testing, we simply loaded 15GB video, music, photo and OS files onto the Yottamaster Y7000 Pro Gen4 4TB SSD and copied the data to a new folder on that same disk.
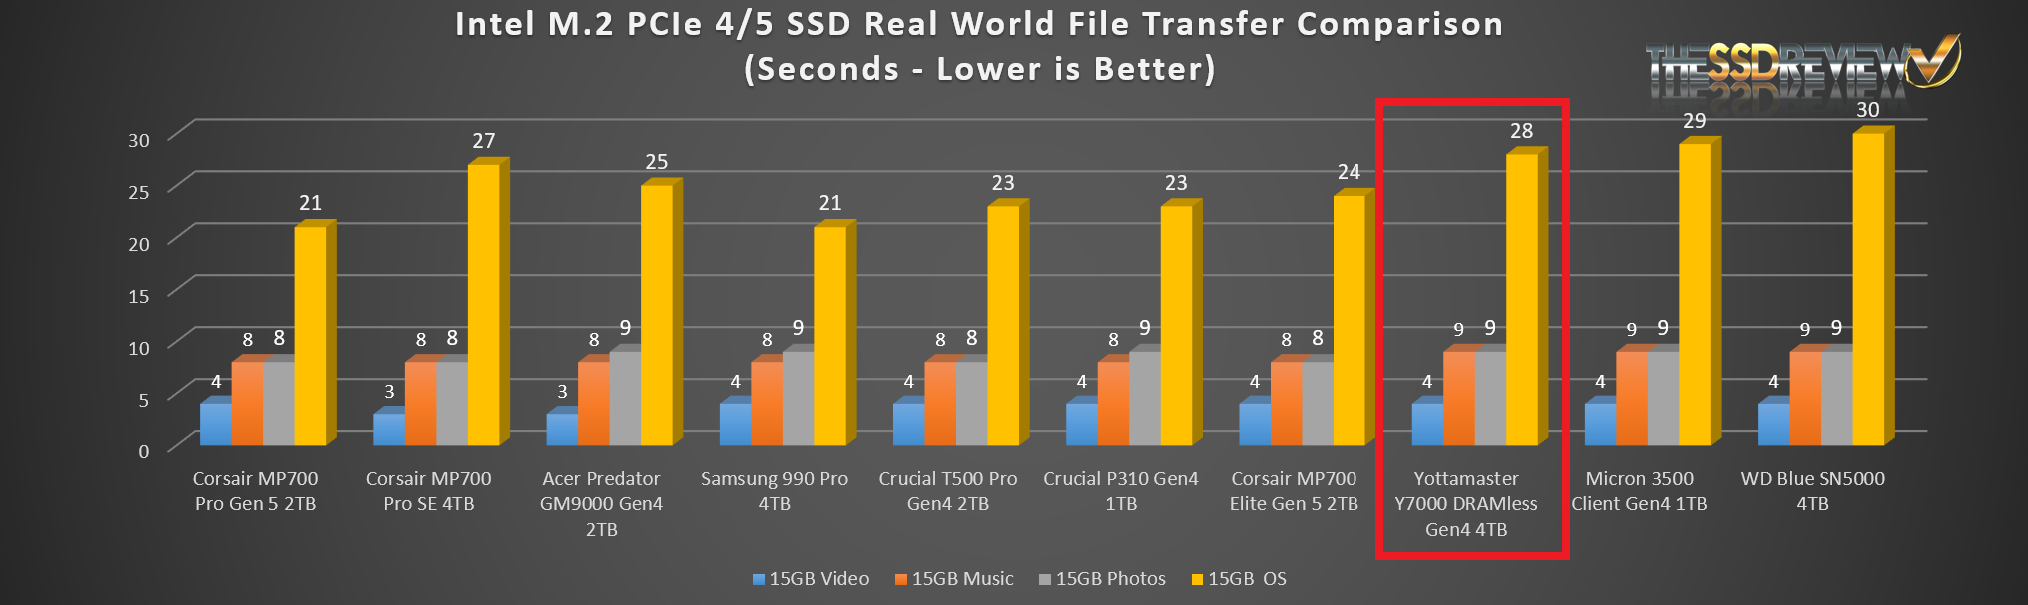
This is not a ranking, but rather, an example of how the Y7000 Pro placed amongst other SSDs. It’s also fair to note that we don’t include the timings of OS transfer in our final placement as OS data is affected significantly with different chipsets.
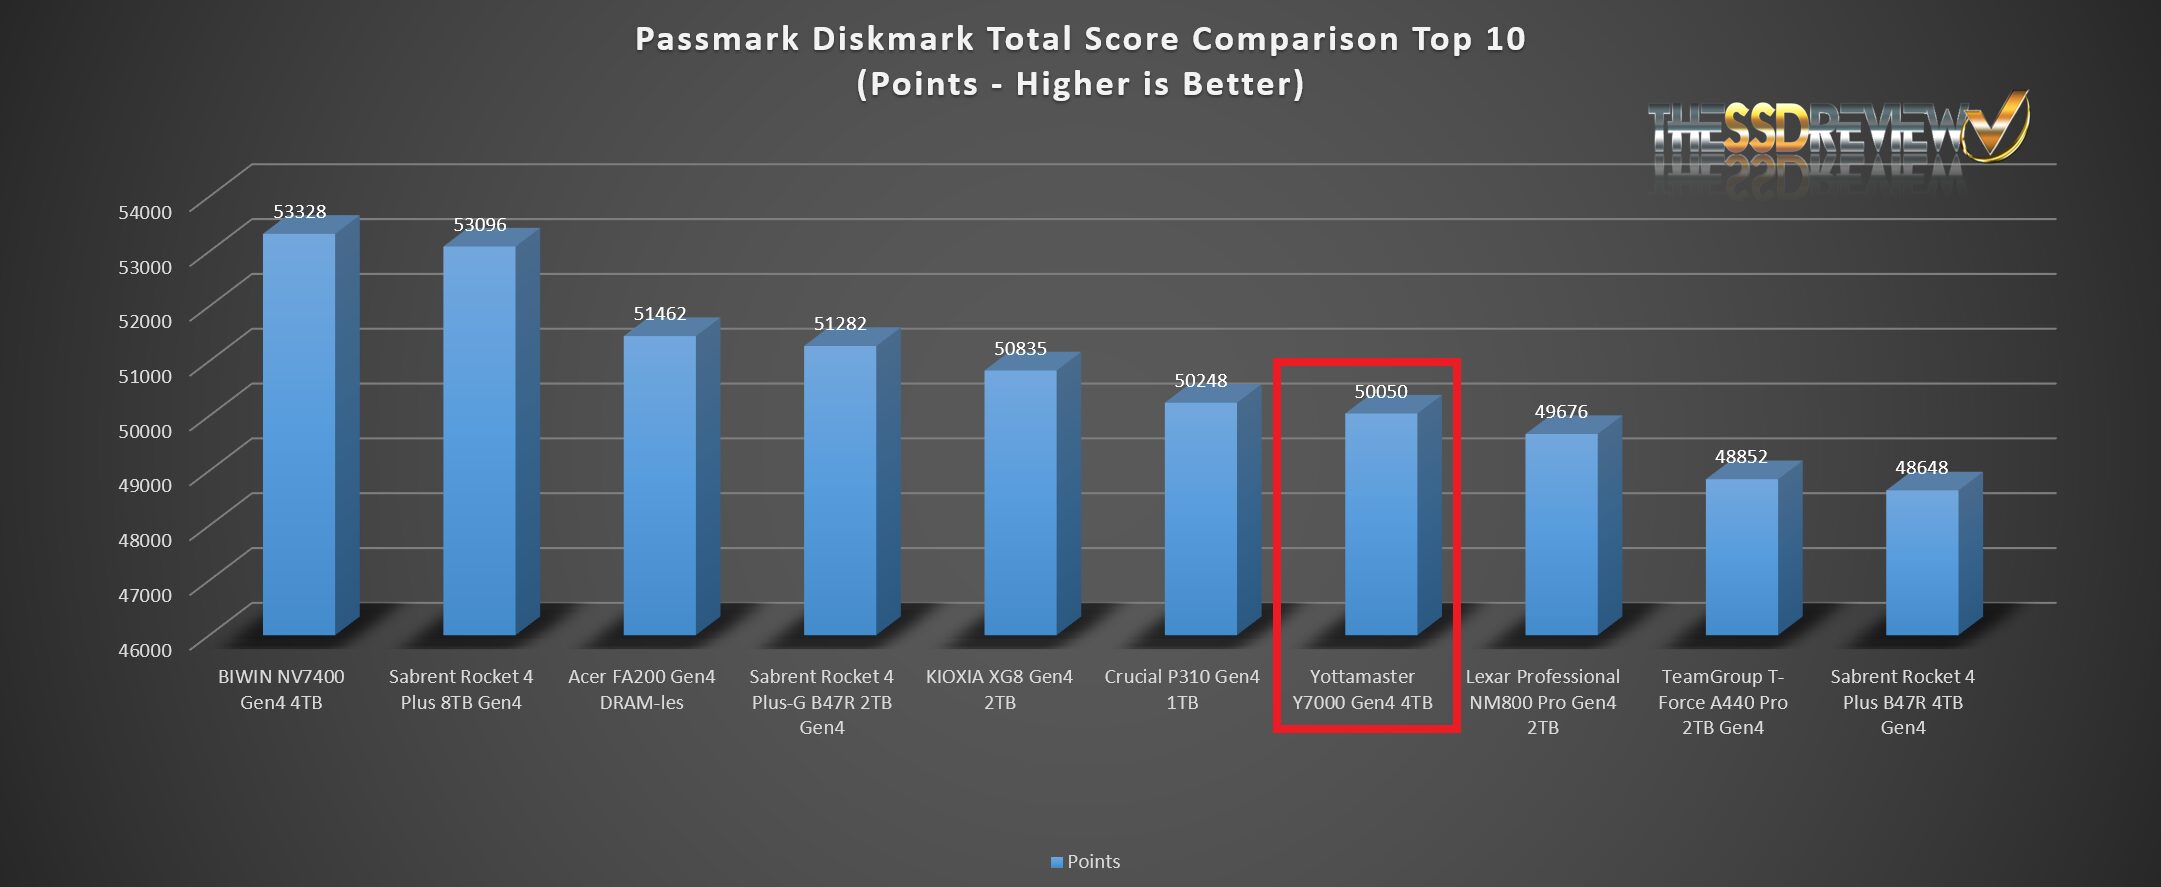
We thought we might add a few extras in our report today, PassMark Performance Test DiskMark component being a nice addition. This software tests sequential reads and writes, along with IOPS and compares the result with millions of other SSDs worldwide. We might suggest being in the 99th percentile of all SSDs tested was a nice resul
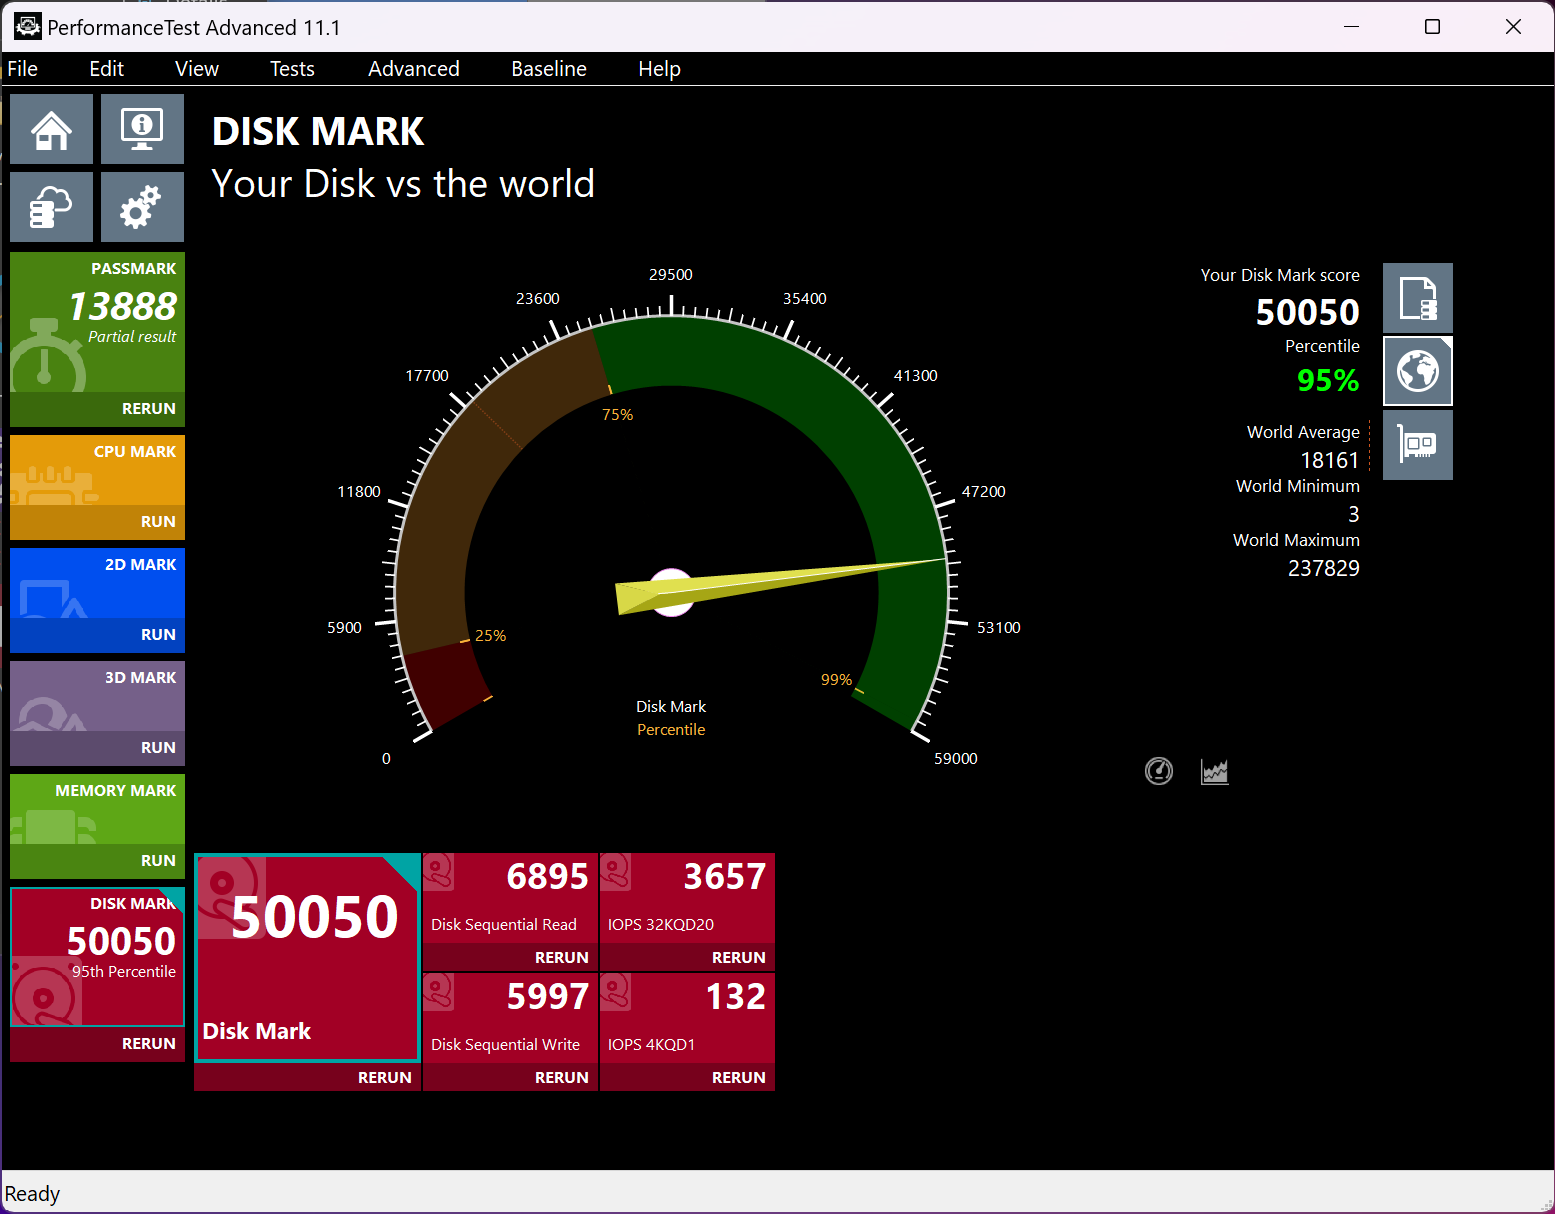
The Yottamaster Y7000 Pro Gen4 4TB SSD achieved decent performance in PassMark Diskmark and placed in the top 95% of all SSDs tested to date. This is not a ranking, but rather, an example of how the Y7000 Pro placed amongst other SSDs.
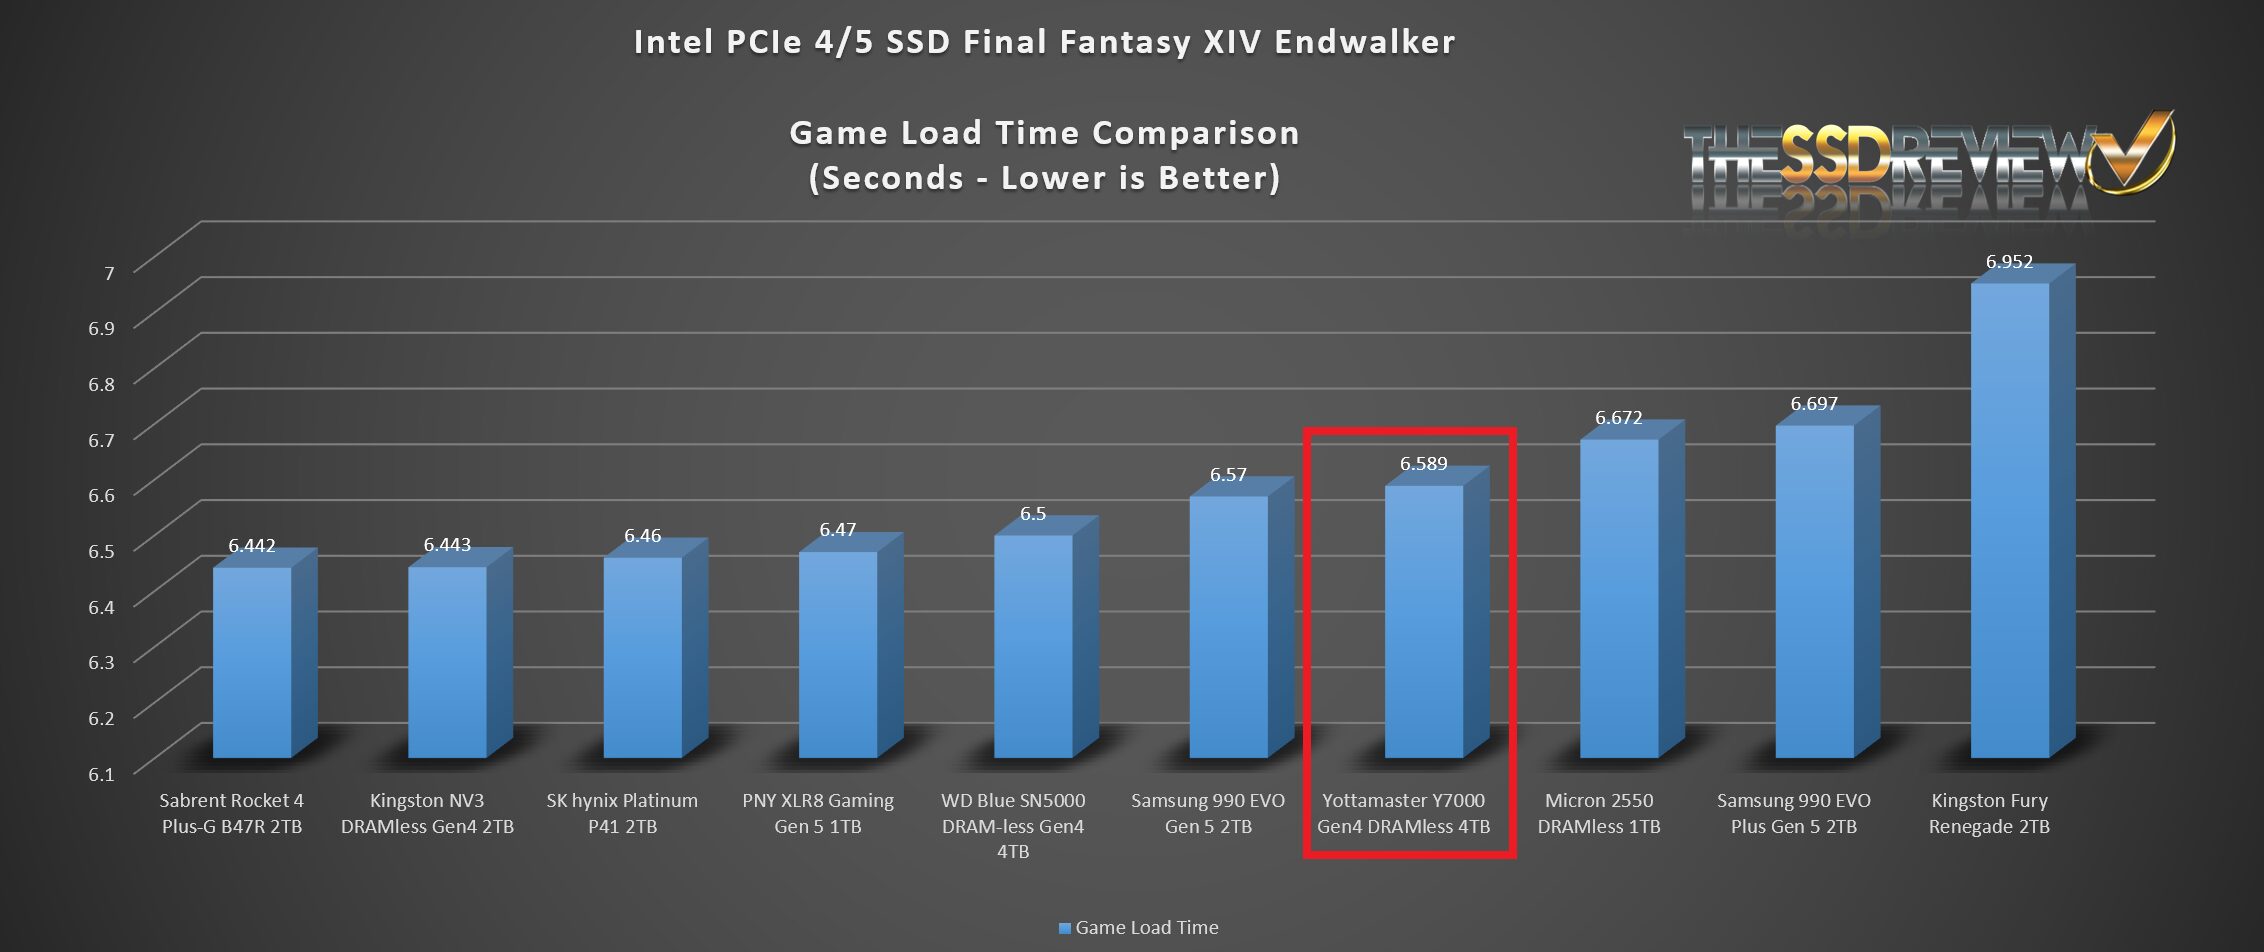
FINAL FANTASY XIV: ENDWALKER BENCHMARK
The Final Fantasy Benchmark is a new tool in our arsenal and geared specifically to the gamer. The software is installed directly on the SSD and the SSD tested, providing and end result of FPS and scene transition times.
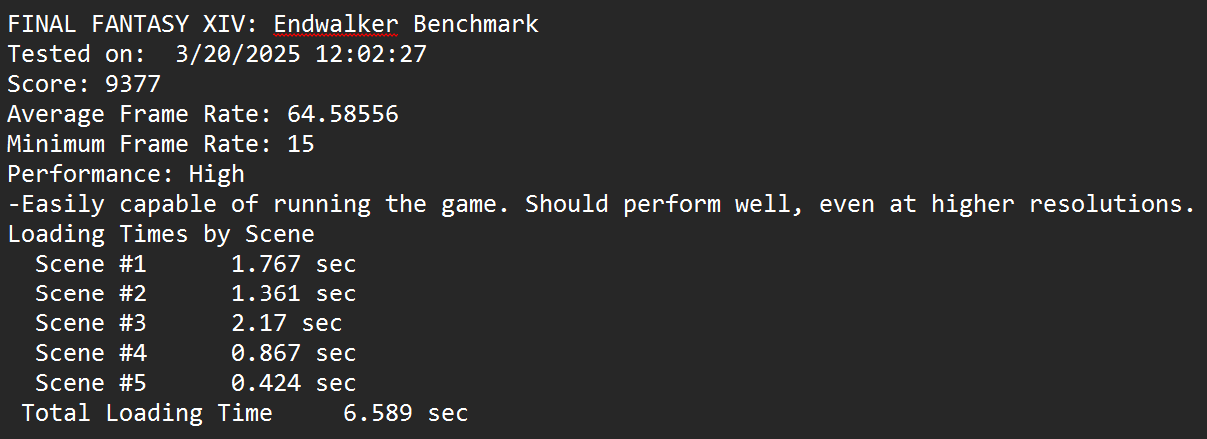
The Yottamaster Y7000 Pro placed well in game load time testing considering it is a mid-level SSD. It placed in exactly the halfway mark of just under 50 SSDs tested to date.